
In statistics, mean has two related meanings:
- the arithmetic mean (and is distinguished from the geometric mean or harmonic mean).
- the expected value of a random variable, which is also called the population mean.
There are other statistical measures that should not be confused with averages - including 'median' and 'mode'. Other simple statistical analyses use measures of spread, such as range, interquartile range, or standard deviation. For a real-valued random variable X, the mean is the expectation of X. Note that not every probability distribution has a defined mean (or variance); see the Cauchy distribution for an example.
For a data set, the mean is the sum of the values divided by the number of values. The mean of a set of numbers x1, x2, ..., xn is typically denoted by  , pronounced "x bar". This mean is a type of arithmetic mean. If the data set were based on a series of observations obtained by sampling a statistical population, this mean is termed the "sample mean" () to distinguish it from the "population mean" (μ or μx). The mean is often quoted along with the standard deviation: the mean describes the central location of the data, and the standard deviation describes the spread. An alternative measure of dispersion is the mean deviation, equivalent to the average absolute deviation from the mean. It is less sensitive to outliers, but less mathematically tractable.
, pronounced "x bar". This mean is a type of arithmetic mean. If the data set were based on a series of observations obtained by sampling a statistical population, this mean is termed the "sample mean" () to distinguish it from the "population mean" (μ or μx). The mean is often quoted along with the standard deviation: the mean describes the central location of the data, and the standard deviation describes the spread. An alternative measure of dispersion is the mean deviation, equivalent to the average absolute deviation from the mean. It is less sensitive to outliers, but less mathematically tractable.
If a series of observations is sampled from a larger population (measuring the heights of a sample of adults drawn from the entire world population, for example), or from a probability distribution which gives the probabilities of each possible result, then the larger population or probability distribution can be used to construct a "population mean", which is also the expected value for a sample drawn from this population or probability distribution. For a finite population, this would simply be the arithmetic mean of the given property for every member of the population. For a probability distribution, this would be a sum or integral over every possible value weighted by the probability of that value. It is a universal convention to represent the population mean by the symbol μ. In the case of a discrete probability distribution, the mean of a discrete random variable x is given by taking the product of each possible value of x and its probability P(x), and then adding all these products together, giving  .
.
.
The sample mean may differ from the population mean, especially for small samples, but the law of large numbers dictates that the larger the size of the sample, the more likely it is that the sample mean will be close to the population mean.
As well as statistics, means are often used in geometry and analysis; a wide range of means have been developed for these purposes, which are not much used in statistics. These are listed below.
Arithmetic mean (AM)
The arithmetic mean is the "standard" average, often simply called the "mean".
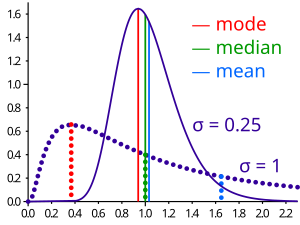
The mean may often be confused with the median, mode or range. The mean is the arithmetic average of a set of values, or distribution; however, for skewed distributions, the mean is not necessarily the same as the middle value (median), or the most likely (mode). For example, mean income is skewed upwards by a small number of people with very large incomes, so that the majority have an income lower than the mean. By contrast, the median income is the level at which half the population is below and half is above. The mode income is the most likely income, and favors the larger number of people with lower incomes. The median or mode are often more intuitive measures of such data.
Nevertheless, many skewed distributions are best described by their mean – such as the exponential and Poisson distributions.
For example, the arithmetic mean of six values: 34, 27, 45, 55, 22, 34 is

Geometric mean (GM)
The geometric mean is an average that is useful for sets of positive numbers that are interpreted according to their product and not their sum (as is the case with the arithmetic mean) e.g. rates of growth.
For example, the geometric mean of six values: 34, 27, 45, 55, 22, 34 is:

Harmonic mean (HM)
The harmonic mean is an average which is useful for sets of numbers which are defined in relation to some unit, for example speed (distance per unit of time).
For example, the harmonic mean of the six values: 34, 27, 45, 55, 22, and 34 is

Relationship between AM, GM, and HM
AM, GM, and HM satisfy these inequalities:
Equality holds only when all the elements of the given sample are equal.
No comments:
Post a Comment