
In mainstream economics, economic surplus (also known as total welfare or Marshallian surplus after Alfred Marshall) refers to two related quantities. Consumer surplus or consumers' surplus is the monetary gain obtained by consumers because they are able to purchase a product for a price that is less than the highest price that they would be willing to pay. Producer surplus or producers' surplus is the amount that producers benefit by selling at a market price that is higher than the least that they would be willing to sell for.
In some schools of heterodox economics, the economic surplus denotes the total income which the ruling class derives from its ownership of scarce factors of production, which is either reinvested or spent on consumption.
In Marxian economics, the term surplus may also refer to surplus value, surplus product and surplus labour.

Overview
On a standard supply and demand diagram, consumer surplus is the area (triangular if the supply and demand curves are linear) above the equilibrium price of the good and below the demand curve. This reflects the fact that consumers would have been willing to buy a single unit of the good at a price higher than the equilibrium price, a second unit at a price below that but still above the equilibrium price, etc., yet they in fact pay just the equilibrium price for each unit they buy.
Likewise, in the supply-demand diagram, producer surplus is the area below the equilibrium price but above the supply curve. This reflects the fact that producers would have been willing to supply the first unit at a price lower than the equilibrium price, the second unit at a price above that but still below the equilibrium price, etc., yet they in fact receive the equilibrium price for all the units they sell.
Calculation from supply and demand
The consumer surplus (individual or aggregated) is the area under the (individual or aggregated) demand curve and above a horizontal line at the actual price (in the aggregated case: the equilibrium price). If the demand curve is a straight line, the consumer surplus is the area of a triangle:

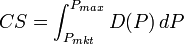
Where Pmkt is the equilibrium price (where supply equals demand), Qmkt is the total quantity purchased at the equilibrium price and Pmax is the price at which the quantity purchased would fall to 0 (that is, where the demand curve intercepts the price axis). For more general demand and supply functions, these areas are not triangles but can still be found using integral calculus. Consumer surplus is thus the definite integral of the demand function with respect to price, minus the definite integral of the constant function D(P)=Qmkt (i.e. PmktQmkt), from the market price to the maximum reservation price (i.e. the price-intercept of the demand function):
Distribution of benefits when price falls
When supply of a good expands, the price falls (assuming the demand curve is downward sloping) and consumer surplus increases. This benefits two groups of people. Consumers who were already willing to buy at the initial price benefit from a price reduction; also they may buy more and receive even more consumer surplus, and additional consumers who were unwilling to buy at the initial price but will buy at the new price and also receive some consumer surplus.
Consider an example of linear supply and demand curves. For an initial supply curve S0, consumer surplus is the triangle above the line formed by price P0 to the demand line (bounded on the left by the price axis and on the top by the demand line). If supply expands from S0 to S1, the consumers' surplus expands to the triangle above P1 and below the demand line (still bounded by the price axis). The change in consumer's surplus is difference in area between the two triangles, and that is the consumer welfare associated with expansion of supply.
Some people were willing to pay the higher price P0. When the price is reduced, their benefit is the area in the rectangle formed on the top by P0, on the bottom by P1, on the left by the price axis and on the right by line extending vertically upwards from Q0.
The second set of beneficiaries are consumers who buy more, and new consumers, those who will pay the new lower price (P1) but not the higher price (P0). Their additional consumption makes up the difference between Q1 and Q0. Their consumer surplus is the triangle bounded on the left by the line extending vertically upwards from Q0, on the right and top by the demand line, and on the bottom by the line extending horizontally to the right from P1.
Rule of one-half
The rule of one-half estimates the change in consumer surplus for small changes in supply with a constant demand curve. Note that in this special case where the consumer demand curve is linear, consumer surplus is the area of a triangle. Following the figure above,

where:
- CS = Consumers' Surplus
- Q0 and Q1 are the quantity demanded before and after a change in supply
- P0 and P1 are the prices before and after a change in supply
No comments:
Post a Comment